Stock Market Analysis Dashboard
NSE-focused analysis: live quotes, technicals, fundamentals, forecasts.
Overview
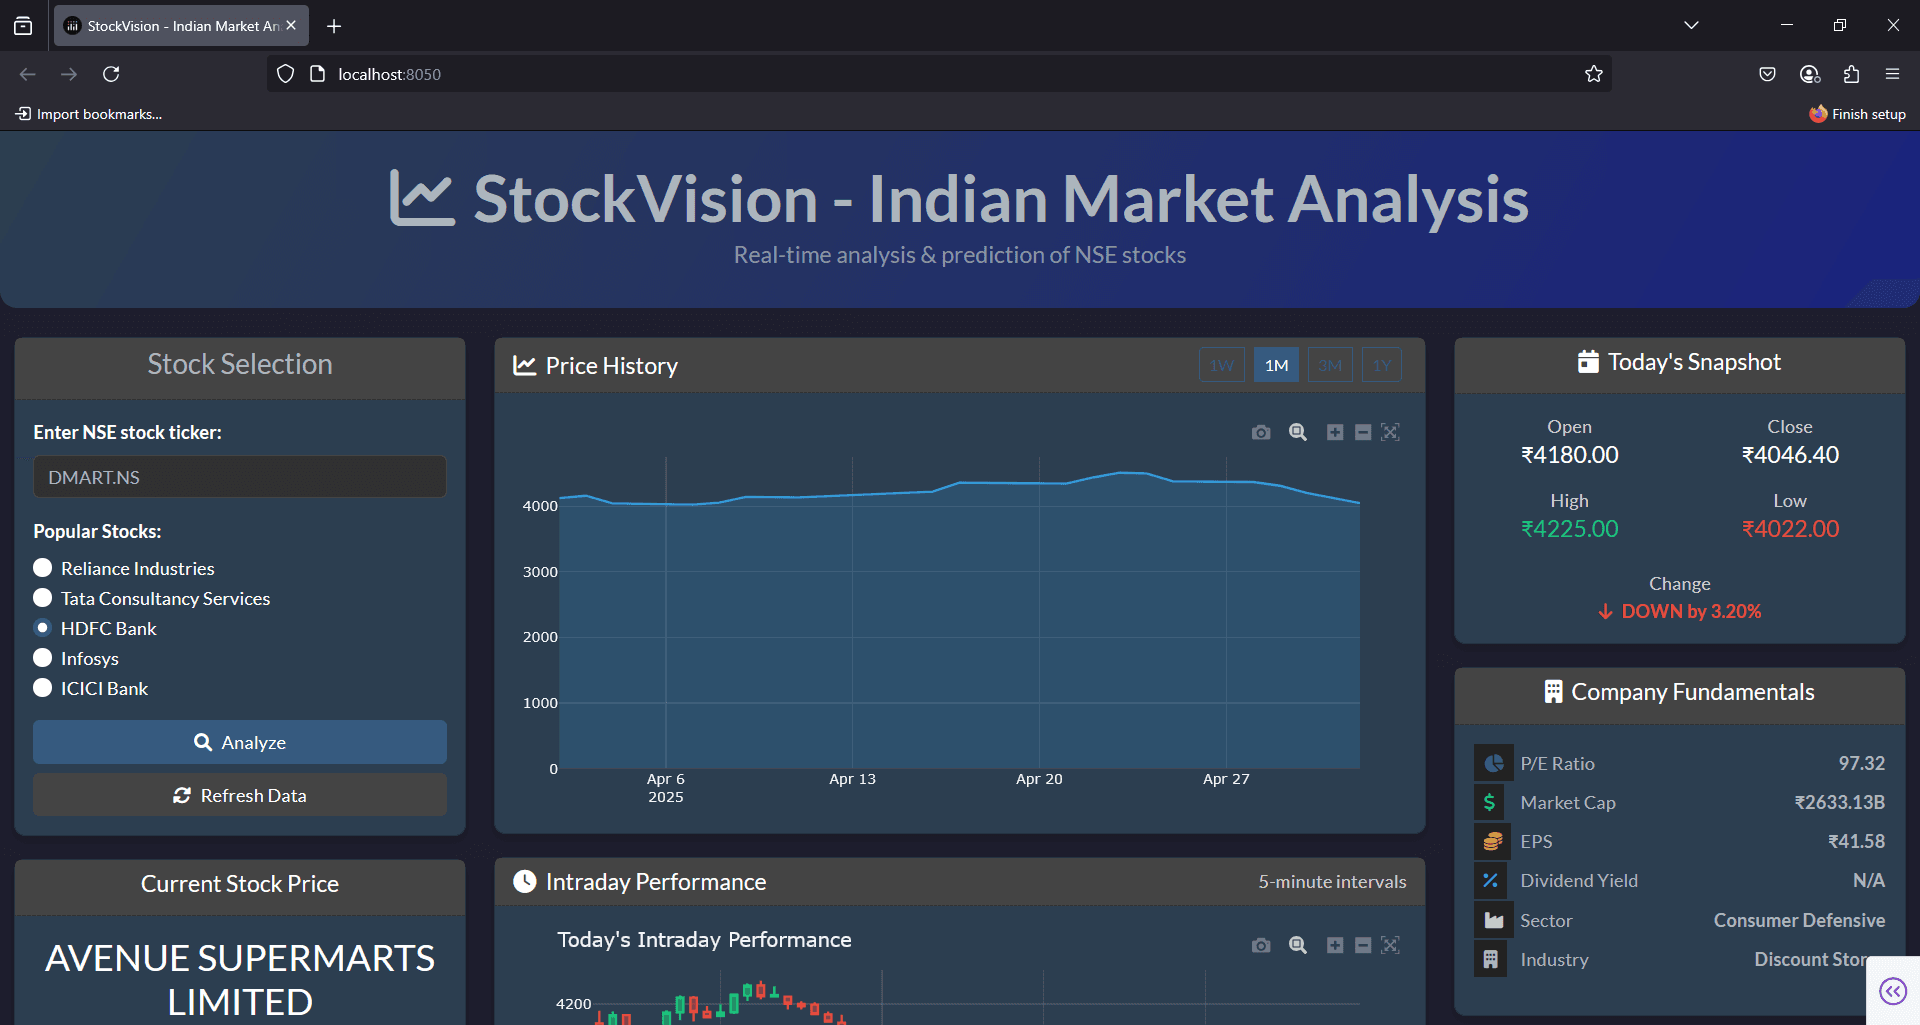
StockVision is a professional-grade stock analysis dashboard for the Indian market (NSE). It consolidates live quotes, technical indicators, financial statements, and short-horizon price forecasts in one dark, data-dense interface.
Analysts can pull any NSE ticker (e.g. RELIANCE.NS, TCS.NS), inspect intraday and multi-timeframe charts, compare normalized performance across tickers, and review fundamentals, quarterly results, balance sheet, cash flow, and key ratios.
Predictions use linear regression for a simple 5-day forward view — useful as a teaching and prototyping layer alongside classic technicals (SMA, RSI, Bollinger Bands).
Key features
- ✓Live quotes: price, OHLC, volume, % change for NSE tickers
- ✓Intraday candlesticks and 1W / 1M / 3M / 1Y history
- ✓Technical overlays: SMA 20/50, RSI, Bollinger Bands
- ✓Normalized multi-ticker comparison charts
- ✓Company fundamentals and key financial ratios
- ✓Quarterly results, balance sheet, cash flow, income statement
- ✓5-day linear-regression price forecast
- ✓Auto-refresh every 5 minutes + manual refresh
Real-world usage
Where this kind of system shows up outside a portfolio context.
- Retail traders screening NSE names with technical + fundamental context
- Students learning how market data APIs feed interactive dashboards
- Analysts comparing two tickers on a shared percentage scale
- Quick research before deeper due diligence in a full brokerage terminal
Challenges
- Handling missing or delayed market data gracefully
- Keeping a dense multi-panel UI readable without clutter
- Separating educational forecasts from production trading signals
What I learned
- Dashboard layout and refresh strategy matter as much as indicators
- Financial statement views need careful null handling from free APIs
- Simple models are fine when framed as exploratory, not guarantees
Related projects
More work in a similar space or stack.
Want something like this built?
I'm open to internships, collaborations, and product work across backend, AI/ML, and full-stack apps.